Friday, September 24, 2010

The Usual Suspects

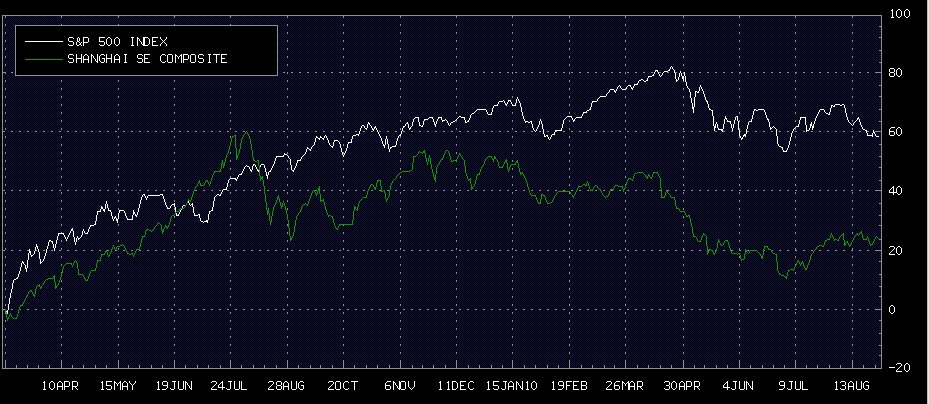
The Financial Sector is under heavy selling pressure once again after European Bond-Spreads fuelled fears that things in Europe are not as pretty as investors wish it to be. As the Atlanta Fed notes in its latest comments, European bond spreads have, for the most part risen and remain elevated since the August FOMC meeting. As of today, the Ireland-to-German spread has increased to 418 bps, and the Portugal-to-German spread has increased to 402 bps - both new records.


On top of that, the release of the existing home sales data for August is showing an increase in inventory by 1.5 % YOY and the year-over-year increase in inventory is especially bad news because the reported inventory is already historically very high (around 4 million), and the 11.6 months of supply in August is far above normal. As calculated risk notes in its latest report, inventories will put downward pressure on house prices.


The implication for the overall market is that this correction could last a little longer. Looking at the SPY (S&P500ETF), we can assume that it will be difficult to hold the support around 112.51. If this is the case, the market will likely test the next support at around 109.51.

Wednesday, September 22, 2010

The US-Dollar Is Resuming It's Downtrend

The two first Charts below are showing the USDCHF cross over different time frames. To get a long term perspective of this currency pair, I plotted the monthly chart since 1992. For the past 2 years, the USDCHF cross rate is displaying a huge Flag, which in fact is a trend continuation pattern. This currency pair will test the all-time low of 0.9790 in the coming days.


USDCHF: A fresh new sell signal in the daily time-frame


The question is, if it can hold the all-time lows. An answer for a short term move could give us the daily price structure of the EURUSD cross rate. The Euro broke to the upside against the US-Dollar at 1.3230. The Point&Figure chart will confirm the break-out, once we are trading above 1.3405. The technical picture for the US-Dollar deteriorated sharply after markets started to expect more quantitative easing by the FED.


Looking at the current technical set-up, we can expect acceleration to the downside for the US-Dollar once the Euro is confirming its break out against the USD and the Swissi has made a new all-time low. Last but not least, Elliott Wave's Prechter says he is bullish on the US Dollar. Maybe we are trading in the 5th. wave... Time will tell.

Monday, September 20, 2010

Kali & Salz Heading Towards A Major Break-out

Kali&Salz (SDF) has been trading in a triangle for almost 18 month. Today, the stock is rising sharply, accompanied by good momentum and breaking the triangle resistance at EUR 44.2. A confirmation of the break-out will take place at EUR 46. Soft-commodities are once again on a strong note this morning, supporting this morning’s rise in K&S.


Trading The USD Ahead Of The FED Meeting

The USD starts the week with a fall towards crucial supports. With the FED meeting ahead, traders do not believe that the US currency will get a lot of help from that meeting. The important support to watch this week is the 79.56 level. Once we break that level, a new clear new sell signal will emerge, which could spark another round of buying in the commodity space.


DXY P&F: Will give a sell signal @ 79.56

Thursday, September 16, 2010

Shanghai Composite Index falls, Europe and US remain strong

Chinese property prices will start to fall sharply next quarter and the decline will extend into the first half of 2011, a government researcher said in remarks published on Thursday. There where also rumors of deposit rate caps to be lifted. We usualy gauged the strength of the Chinese economy by watching the price of copper and oil. But with the expectations of more Q-Easing from the FED in November, investors have been fleeing into commodities for the past several days and hence, commodities could be a bad indicator for the health of the Chinese economy. It is certainly worth having a look at the technical picture of the Chinese Stock-Market.

SH COMP P&F Chart


SH Composite


On the other hand, we have European & US Indices that keep on challenging important resistance levels. It will be interesting to see how investors behave next week, after Friday's Options & Futures expiry. If too many Investors have locked in gains by writing calls on their positions, it could well be that they will be forced to deliver stocks against short calls. If this is the case, equity markets would be well protected to the downside since investors will give up exposure through the expiry. There could be a real capitulation of the bears ahead, that could push the markets up again in the comming weeks. I would not view this upmove as a long term positive buy signal, but rather some more action of a top building phase.


SMI: remains in break out territory


DAX: heading towards break-out territory


SPY: break-out territory


QQQQ: break-out territory

Latest AAII Investor Sentiment Survey:

The worrisome factor in this market is the steady rise of bullish sentiment, as the market is trading around the obvious resistance levels:

bullish: 50.9 % - up 7

neutral: 24.9 % - up 0.3

bearish: 24.3 % - down 7.4

Wednesday, September 15, 2010

Corn Futures: 3 White Soldiers

The Chart below plots the weekly price structure of the continuous Corn Future Contract. After trading in a two year downtrend, that has emerged after the 2008 “commodity blow off”, Corn broke to the upside at the end of August and made further gains after a positive crop report on the 10th of September.


The commodity space got additional support as Goldman Sachs Analyst J. Hatzius remembered the investment community that with the current weak economic data, another round of Q-Easing is expected to start in November 2010. Some traders got the message wrong, expecting already an announcement for Q-Easing by the FED at the next FOMC Meeting on the 21st of September 2001. This sparked a wave of selling in the USD crosses and helped Gold to a fresh all-time high. While Gold is looking firmly bullish at the current levels, soft commodities are far away from historical highs, and I believe that we are at the beginning of a very strong bull market in soft commodities. The 3 white bar charts that moved Corn out of the downtrend are showing a candlestick pattern, called 3 white soldiers, suggesting that this trend is likely to continue.

An interesting interview on soft-commodities can be viewed on CNBC.com

http://www.cnbc.com/id/15840232?video=1591248479&play=1


Monday, September 13, 2010

We Should Start To Sell This Rally Now

European Equity Markets are following the strong Asian Markets to the upside, with all indices gapping up to the highest levels in 2 month. The positive mood is supported by Chinese comments on strong domestic demand and the release of the Basel III framework. With the AAII Bullish Index at 43.9 %, a new 3 month high, we should use this overly bullish sentiment to reduce exposure and ad some shorts. For the past 8 trading days, equity markets rose with extremly low volume to the levels we are seeing today. As you can see from the charts below, there is still some room to the upside, but the risk reward favours definitely the short side this week.


Last Weeks AAII Index Readings:
Bullish: 43.9 %
Bearish: 31.6 %
Neutral: 24.5 %


Sunday, September 12, 2010

Number Of The Week: 1.9 Trillion Euros


1.9 Trillion Euros: European Banks’ Exposure To EU Government Debt

2 Days after Germany's Hypo Real Estate's announcement, it would need another € 40Bn of new guarantees from the Government, The Wall-Street Journal is taking a closer look at the European Banking Stress Test. Below is a summary of the Wall-Street journal article as well as some comments from calculatedrisk.

With each passing day, it’s getting harder to believe Europe’s banks are in as good shape as their regulators say. That could be a problem for a global economy still struggling to recover from a deep recession. Less than two months ago, an outfit called the Committee of European Banking Supervisors published stress tests aimed at easing investor concerns that the financial troubles of Greece and other countries would spread to Europe’s banking system. The reassuring result: Only seven out of the 91 banks tested would need to raise added capital in the event of a modest double-dip recession and a sharp drop in the value of Greek, Irish, Portuguese, Spanish and Italian government bonds.

The EU-wide stress test did not include haircuts for sovereign debt held in the banking books of banks on the grounds that over the 2 years considered default is virtually impossible in the presence of the EFSF [European Financial Stability Facility Special Purpose Vehicle], which is certainly large enough to meet funding needs of the main countries of concern over that period.

The haircuts applied to the trading book in the stress test are shown in the first block of Table 1. The trading book exposures (not reported in the stress test paper) are also shown. The EU wide loss from the haircut is around €26. bn. The contribution of the 5 countries where most of the market focus has been (Greece, Portugal, Ireland, Italy and Spain) is only € 14.4
Bn.


A different picture emerges when we consider the banking book. First it is important to note that the EU banking book sovereign exposures are very much larger than those of the trading book—around 83% of the total. If the same haircuts are applied to these exposures the loss amounts to €139bn, or 12% of the Tier 1 capital of the EU banks at the end of 2009 (and €165bn and over 14% of Tier 1 if trading book losses are added in). The haircuts of the 5 countries of market focus amount to € 75.8bn in the banking book, and € 90.2bn if the trading book amount is added in. This is around 8% of EU Tier 1 capital of stress tested banks.

This study has shown that most of the sovereign debt is held on the banking books of banks, whereas the EU stress test only considered their small trading book exposures. Sovereign debt held in the banking book cannot be ignored however. First, individual bank failures would see latent losses on the trading book realized, a fact that creditors and equity investors need to take into account. Second, and more importantly, the market is not prepared to give a zero probability to debt restructurings beyond the period of the stress test and/or the period after which the role of the EFSF SPV comes to an end. The main reasons for this are: the very large job ahead for fiscal consolidation in a period of weak economic growth; and the apparent difficulty of achieving structural/competitiveness reforms in some countries in a short period of time. The paper also showed that excessively exposed banks in principle can reduce their exposure by not re-financing maturing sovereign debt, with the government funding gap being met instead by the SPV. This would have the effect of transferring sovereign risk from the bank concerned to the public sector.

What happens in less than 2 years when the European Financial Stability Facility Special Purpose Vehicle is no longer providing funding?


Friday, September 10, 2010

The Crop Report

On Friday, September 10th, at 7:30 AM central time the U.S.D.A. will release its monthly crop report. This report as well as the next in October will be two of the most anxiously awaited and traded reports of the last two years, due to its widely and varied opinions on its results. There is a fear in the market that this report could be very bullish, therefore no one will want to be short and speculators will want to buy long. A combination of short covering or buying back of short positions and new speculative long position buying paved the way to new contract highs on the month for soybeans, corn and wheat and highs for the year for corn and beans this week. It's always easier to figure out how large trading funds will trade prior these reports, than what the government feels it wants to report.

Thursday, September 9, 2010

SPY Meets Gap Resistance @ 111.5

The Chart below plots the hourly price structure of the S&P500 ETF "SPY". On Thursday, the market gaped to the upside after better than expected economic numbers but faces now resistance at the gap resistance of USD 111.5. Traders have to be aware that this recent rebound has been accompanied by very low volume and there is still no evidence that investors are heavily buying into equities. In addition, there is still a negative Momentum divergence in place, showed by the red lines.


This Friday, Credit-Suisse is writing in their morning report, that there is still a lot of cash on the sidelines and they see Fund Manager sitting on 30 % cash levels. This may be true, but the question is what the money will be used for. It looks as if Equity Funds are getting hit with waves of redemptions. The chances are high that this cash will not flow into equities in the short run. Also, the high level of bearishness has been reduced and bullish sentiment is on the rise. A further rise in bullish sentiment this week coupled with a low volume rally could be an indication that this move to the upside has no legs.


Wednesday, September 8, 2010

Flight To Safety

The Chart below compares the daily price structure of the EURO STOXX 50 versus the European Healthcare Sector. After the strong rebound in the main Indices, Healthcare has continuously been accumulated by investors and the sector is now showing a clear outperformance vs. the broad market since the beginning of the year. I do not view this as a positive development for equity markets going forward as more investors do not believe in a sustainable recovery of the economy and hence start to buy a defensive sector like healthcare.


Tuesday, September 7, 2010

Gold Rises On FED Comments

PIMCO's Tony Crescenzi says the FED wants to push Investors from money market funds. I bet this is not a good idea. Following the comments, Gold rose to an intraday high of USD 1259.75. The ultimate Resistance that has to be broken is @ USD 1269.5. Wether the FED wants to push Investors into equities or commodities remains to be seen. For now, only Gold is on the rise. Gold is now moving out of a bigger triangle on healthy momentum. Unfortunately, the strong downside momentum impulse has been erased with the strong rebound on Friday and the chances to buy below USD 1244 are suddenly very small. A better place to look at right now are Gold Stocks.

XAU 60'

A stock that is ready to break out to the upside is NovaGold (NG). A break out of the trading range would take place at USD 7.56. The break out would be confirmed at USD 7.84. Take the 20 Day Moving Average for a close Stop loss. The rally is over if Novagold falls below USD 6.70.

NG Daily


Monday, September 6, 2010

Bailing Out The Kabulbank

....Yet U.S. officials worry at the same that its woes and the government-financed bailout, brought on by allegations of corruption and insider dealing, will set back faltering Western efforts to restore confidence in President Karzai's administration, a pillar of the allied strategy for defeating the Taliban.


full report:

http://online.wsj.com/article/SB10001424052748704095704575473650615414666.html?mod=WSJ_hps_LEFTTopStories

60' SPY & Sentiment Indicators

The chart below plots the 60’ price structure of the S&P 500 ETF SPY. After having gapped up above resistance, following a better than expected U.S. jobs report, it managed to close at the days high, despite the negative divergence in place. The next resistance is located at around 112.3, where the August Gap would be closed. Despite the strong advances of the past week, bearish sentiment remains relatively high. This could be a positive event for equity markets in the beginning of the week.


Last Weeks AAII Investors Sentiment Readings:

Bullish: 30.8 % Bearish: 42.2 % Neutral: 27.0 %


Friday, September 3, 2010

Negative Divergence On The SPY

As everybody has suddenly a positive view on the "mild but sustainable" recovery of the US economy, it would be wise to take some chips of the table. The SPY got rejected at gap resistance, and the momentum is slowly fading away. It will probably take some time until the negative divergence puts in a real sell signal, but the short term upside looks very limited from here. Traders who have bought the market on a contrarian basis at the beginning of the week probably have no problems with selling ahead of a long week-end.

SPY, hourly with MACD


Gold Gets Hammered After Non Farm Payroll Data

Gold broke support at USD 1244 after the release of the U.S. non farm payroll data. The MACD is showing an impressive new momentum low, suggesting that the correction could last a little bit longer. The 20 Day moving average rises at USD 1228, next support is 1218.5. A break out in Gold occurs when it moves above USD 1269; the Bull Market in Gold is over if it falls below USD 1150. To find a good risk reward here is difficult. I still believe in a break out to the upside but there is no reason to get overly bullish or bearish here. Having a look at the daily chart, we have a negative divergence developing on the MACD, but the long term trend is intact. There could be some back and forth action between USD 1217 & 1244 until Gold decides which way to go.


Gold Remains In Break Out Territory

The Chart below plots the hourly price structure of Gold over the last 14 trading days. After breaking resistance at USD 1244, the metal now consolidates above that important level, forming a consolidation triangle. A break out of this triangle to the upside would be firmly bullish and a clear sign that Gold is challenging its all time high of USD 1265. Long positions will only pose a problem if Gold falls below 1244 again. But for now, the set-up looks firmly bullish.


Thursday, September 2, 2010

Soft Commodities: Catch Up!

The Chart below shows the comparative Returns of Syngenta Corp., Corn and Wheat. Soft commodities had a strong rally, starting mid may. As you can see, Syngenta Corp. outperformed soft-commodities which didn’t make much sence. Now Corn and Wheat are catching up…


The Chart That Rocked The Bear Cave

The Chart below is from http://www.calculatedriskblog.com/. As you can clearly see, the August ISM PMI didn't catch up with the falling Avg. Philly, NY Index and the Avg. Fed Surveys. The Bears got smashed yesterday as the Index posted a rise to 56.3 % instead of a decline, as expected from traders and investors. The current market setup suggests that it will take a little bit more time to put a top on the markets.


Wednesday, September 1, 2010

Short Squeeze

Finally we are getting the short squeeze in equities I expected in the beginning of the week. The Future led buying helps all sectors across the board in Europe. The most interesting sector to watch is Gold, where GDX is heading towards a major break out at USD 55. The pattern looks like a cup and handle and all technical Indicators favour a move above USD 55 right now. In the premarket, GDX trades at 54.51 right now, up 90 cents, but only 8000 shares changed hands.


If you are desperately looking for exposure, I would prefer a defensive sector. Looking at Sanofi in France, the company is still struggling to buy Genzyme Corp. in the U.S.If this deal would be a big positive for the company remains to be seen. What I can see from here is that the stock is moving out of a falling wedge, challenging resistance at EUR 46.5, where you can also find the 50 day moving average. A break of EUR 46.5 would give a clear buy signal.


Traders should not chase the rallies at this point, because chances are high that we witness only a rebound from the obvious support in the S&P at 1040. But keep GDX & SAN on your radar.