

The week started with some back and forth moves, but overal the action is absolut trendless. Below I posted some 60' Charts, so we can zoom in and understand short term price moves. Several Indices display triangles. Triangles are a result of agressive buying and selling. On a technical basis, there is no way to tell in advance if the market will break to the up- or downside. The Eurostoxx50 is the first market that moved out of it's triangle, but the support of 2925 is still holding up well. The market has certainly started a consolidation, but for a stronger move to the downside we need to break the supports mentioned below.
SPY: support is 131.08 & 129.56(minor) &127.4 (bigtime)
Dow Jones: support is 12035

QQQQ: Resistance is 58.58 / support is 55.25

Eurostoxx: Already out of the triangle, support is 2925

SMI: Support of 6400 is important

DAX: Support is 7190 & 7080
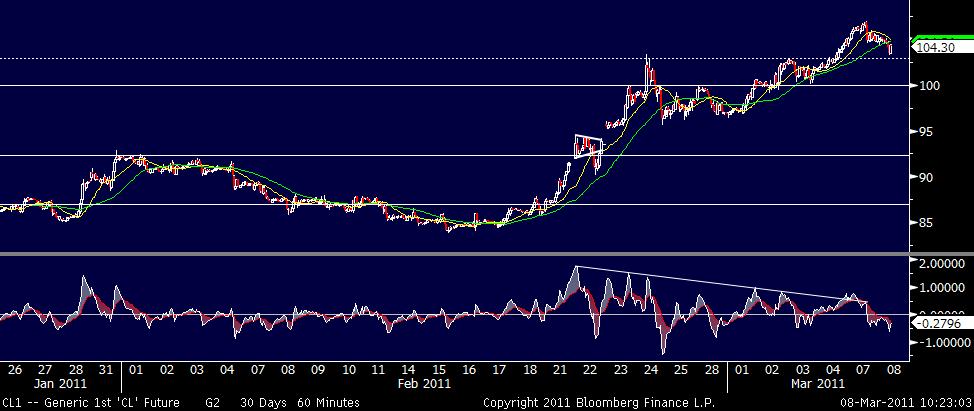
Crude: Fading momentum, consolidating above support

EURUSD: Negative divergence in the 60' the same could happen

SMI: Support of 6400 is important

DAX: Support is 7190 & 7080

Crude: Fading momentum, consolidating above support
EURUSD: Negative divergence in the 60' the same could happen
in the daily time frame
