After the "sell in may and go away" strategy has proven to be successful this year, the month of June has brought even bigger losses, giving me the impression that we are currently in a "sell more in June and short to the moon" strategy. Sentiment has quickly turned very negative, and the break of 12000 in the Dow Jones Industrial does not improve the bad mode among investors. Looking at the daily charts of the major stock market indexes, the chances are definitely high, that equity markets are heading for a major top.
The supporting factor for equities are the incredible amount of cash sitting on the balance-sheets of big corporations. Some sectors also offer reasonable valuations and good dividend yields. But one has to remember: S&P500 P/E`s have fallen several times below 10 in the history of the US stock market. In addition, P/E´s are calculated with analysts expectations, who often are totally wrong.
Markets now enter very oversold conditions. This alone is not a reason to start to buy the dip. There are some indications, that selling pressure could be lifted during the next trading days, as some positive divergences start to unfold in the 60 minutes time frame. The big threat to financial markets remains Greece. If the EU is not able to handle this problem we will head much lower. In this case, the USD will start to rally and commodities could come under heavy selling pressure. The only commodity that has made a fresh new all-time high during the past week is corn. In my view, soft-commodities are the least dependent on economic cycles.
Investors should get ready for a market rebound. If the SPX500 is able to hold the 1274 level remains to be seen. More robust pockets of supports are 1249 & 1235. One rebound is not enough to go long, one big day in the red neither. A simple but powerful indicator is the VIX Index. If the VIX breaks above 20, we should refrain from opening long positions. For now, we have a positive divergence unfolding with the VIX trading below it´s may low, while equity Indexes have broken their may lows.
Charts below are single stock ideas first, Indexes last. Neither Silver nor Gold are currently on our buy list. Just wanted to show where support and resistance are.
Meyer-Burger daily

Silver daily

Syngenta daily
 Mosaic daily
 Google
 EURCHF daily
 EURUSD hourly
 EURUSD daily
 DXY daily
 Wheat daily
 Corn daily
 Crude daily
 Gold daily
 SMI hourly
 SMI daily
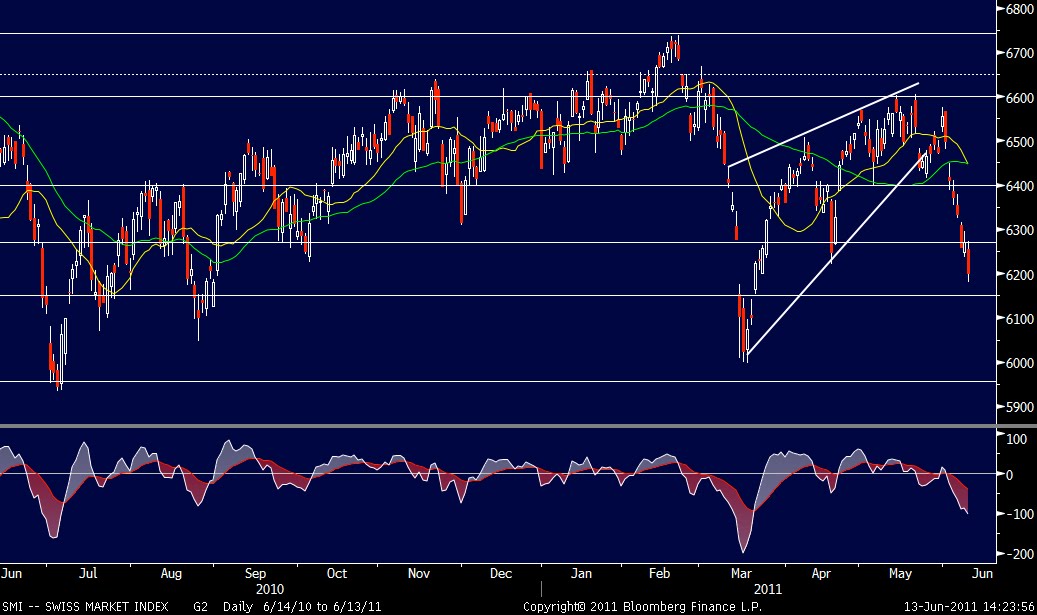 DAX hourly
 DAX daily
 Eurostoxx hourly
 Eurostoxx daily
 VIX daily
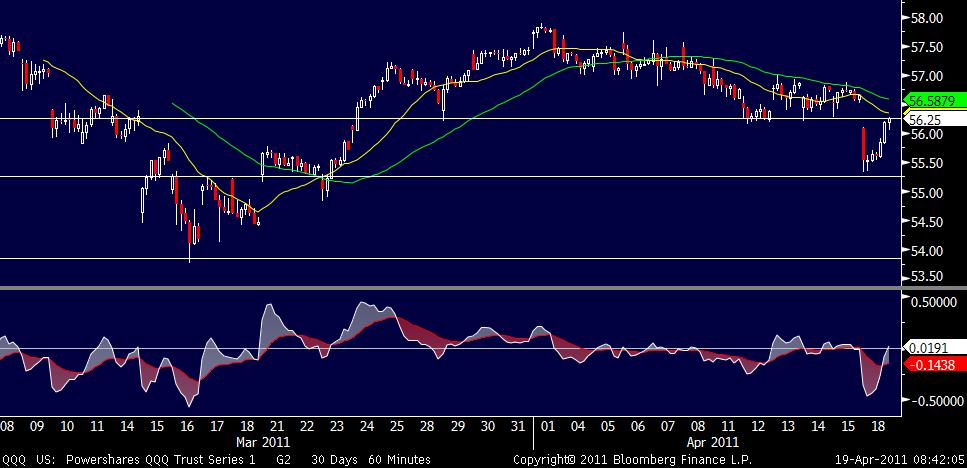
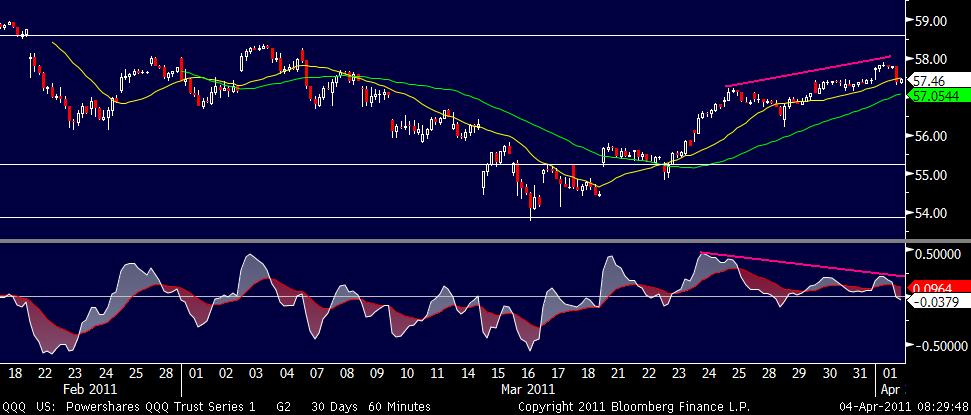
QQQ hourly
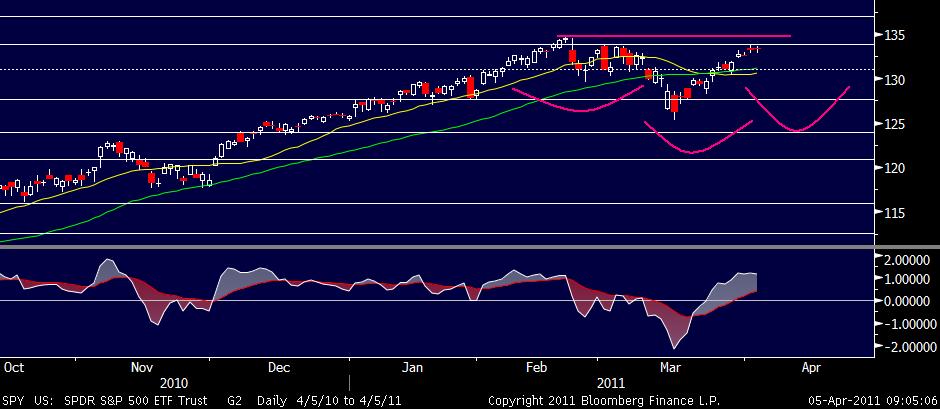
 SPY ETF hourly
 SPY ETF daily
 SPX100 daily:
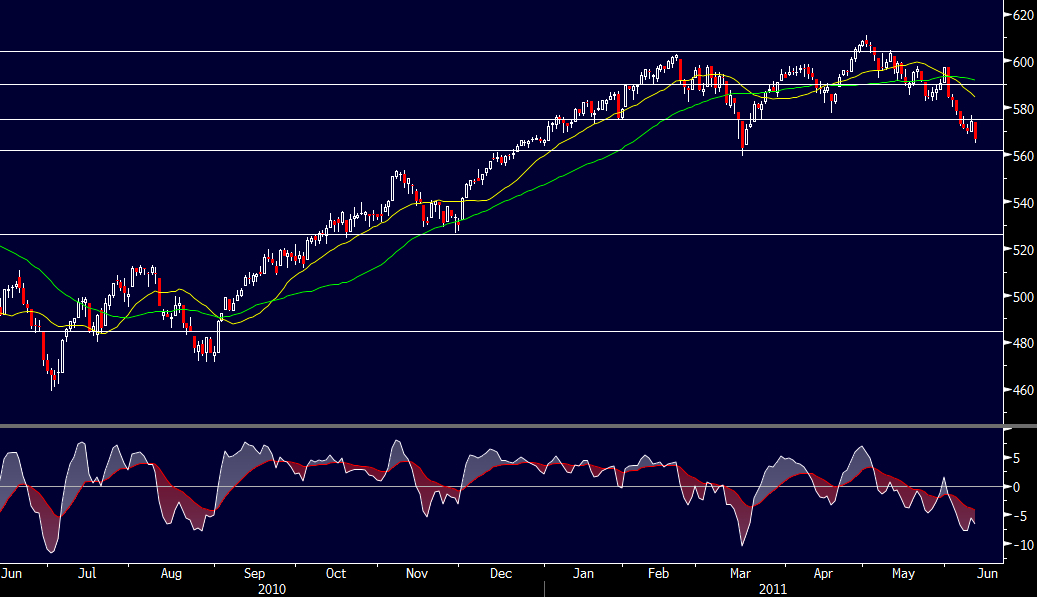 Russel 2000 daily
 NYSE Composite daily
 Dow Jones Industrial daily