Tuesday, April 19, 2011

A Positive Stock Market Cycle Is Slowly Coming To an End

Market Tops take time. From 2006 until 2008, it took almost 3 years to build a top in the Equity Market. I do expect a kind of repeat, starting in the middle of this year. Equities could remain on positive ground until Mai, but working on a distribution pattern as in 2007. None of the problems we have in today's world have been solved. Politicians keep on lying to the public, in order to get reelected. Central Banks get more and more involved with politics. This is fatal. Those Central Banks will lose the fight against deflation. The big deflationary threats will come from a housing crash in China, an shrinking economy in Japan or a strong fall in commodity prices coupled with a rising US Dollar. In my view, we are once again heading for the perfect storm. When politicians will see this, they will go to war. As in 2003, when the US Congress "found out" that there are weapons of mass destruction in Iraq. We have to be very careful with equity investments going forward. This economic recovery is to weak to be self sustaining, in Europe, as well as in the US. As long as the S&P 500 trades above 1270, we still have the power to rebound, but a break of 1290 would erase the chances of an inverted head and shoulder pattern in the S&P500.


The Dow Jones Industrial traded sideways for 2 years before it broke down.


The NYSE A/D line is still a positive factor for the market, but we have to hold the previous low during this correction
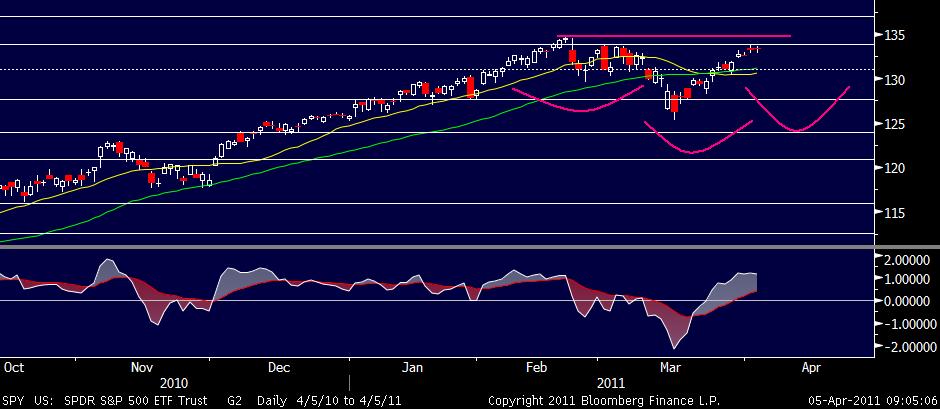
SPY 60': closed the gap, but the new low is a small sell signal. 129.56 has become a important support
QQQ daily time frame: Market has to avoid this double top, 53.85 has to hold

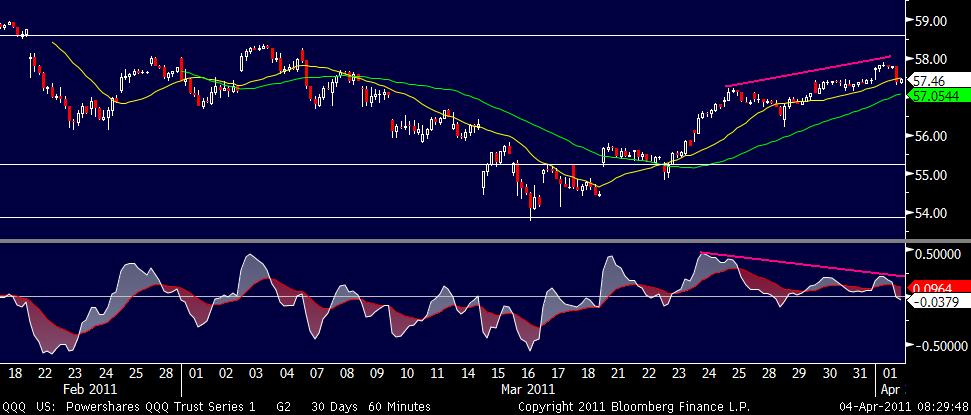
QQQ 60' time frame: A small sell signal in place, short term lower prices in the cards
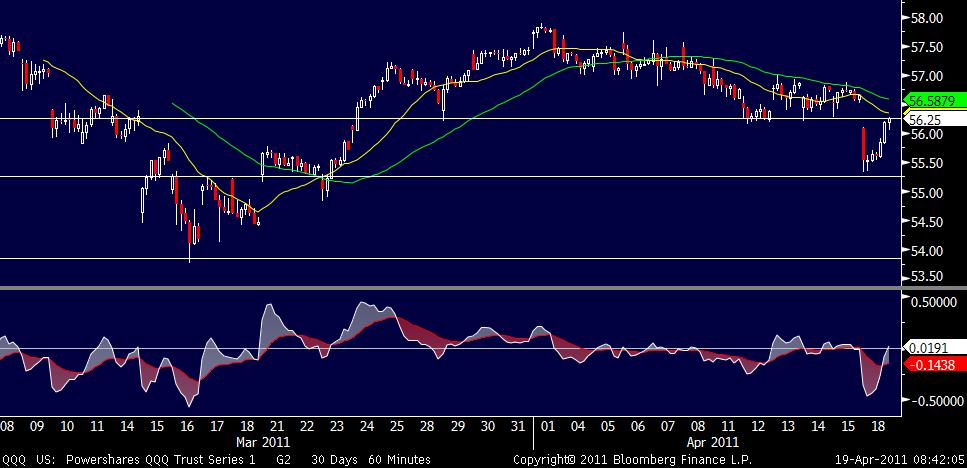
Russell 2000: First we had a break out, now looks like a fake out, 802 is support
Eurostoxx50: Still in an uptrend, but no conviction to go long here yet. DAX: Has more downside potential from here: 6940 gap support, 6850 strong support
SMI: Weighted down by "heavy-weighted" dividend payments and a lagging banking sector. GOOG: After a break-out, a break down.... has to stabilize around 535, not a buy yet
SYST: Break out after bid talks. As long as the stock trades above 146.5, its a buy
EURCHF: sideways, but spectacular :-)

EURUSD: Short position stopped out @ 139.4, wait for another shorting possibility
DXY: A re break of 75.69 would start a bottom building phase. Expect a cycle low mid-year.
Corn: Holding above break out levels, but could start to trade in sync with crude.
Wheat: Still in a trading range

Gold: Broke out, thanks to the help from Central Banks. Uncharted territory
Crude: I expect a top in the coming weeks.


Monday, April 4, 2011

Bears Throw in the Towel

The Bulls charged ahead during the past trading week, erasing almost all the damage caused by the tragic events in Japan. The NYSE Composite Index is still trading slightly below its 2011 high but the NYSE cumulative advance decline line has already broken its highest level of the year, definitely suggesting that there will be another move to break this years highest levels. The US Market is driven by a strong Energy Sector, where the Energy ETF XLE managed to break out. In the NASDAQ market we witness a strong out performance by the Biotech Sector. Health care and Financials are still lagging the overall market, but the big picture, on a technical basis, remains extraordinary strong and healthy. Things can change quickly and the market is once again overbought, but for now, the message is loud and clear: Buy the dips.

The Chart below plots the daily price structure of the S&P500 ETF SPY. I expect the market to make one last move to the downside, before we break out, and move towards 1400. I expect a good entry level for this trade at around 1300. If I am right, we have made 2/3 of this consolidation.


The only one, that could derail this current rally is the USD. The DXY is still sitting on major support, and the break out in the EURUSD has not taken place at 1.4230 yet. If we break 1.4040 in the EURUSD pair to the downside, we should have a look at the DXY. A break above 77.5 would not bode well for equity bulls.


Still trading below resistance at 1.4230 DXY: Sitting on major support


NYSE A/D Line: The strong performance in Small Caps helps the A/D-line to a new high. Small Caps outperform, another short term bullish sign for the market
NYSE: Will follow AD-line, even if we get another pull back
VIX: Volatility sitting on the downtrend, maybe we get a small bounce from this level.

BTK: Biotech outperforms the overall market


QQQ: Negative divergence in the 60' time-frame, don't chase the rally, buy the dips


XLE: The Qaddafi Break-out

XLF: under performing sector, avoid

Equity markets on 60': All showing minor to strong negative divergences, don't chase the rally

DAX: Outperforming but ahead of strong resistance

SMI: Heavy weights Health care and Financials are lagging, under performer

SDF: Potash in Europe, outperforming, but also here we have strong resistance

Syngenta: A break of 320, sparked by a rally in softs, would bode well for the bulls

Corn: Heading towards last resistance at 740, break-out @ 750

Wheat: After an impressing Head and Shoulder top the market rallies back, the re break of 760 is bullish

Crude Oil: Daily Time frame shows weak momentum, resistance @USD110, cycle could turn negative in April
Crude Oil 60': Not really gaining on strong momentum

Gold: Every trade gets sucked back to the USD1431 resistance.

Gold 60': Stuck in a range, the break of USD1431 resistance did not spark another rally