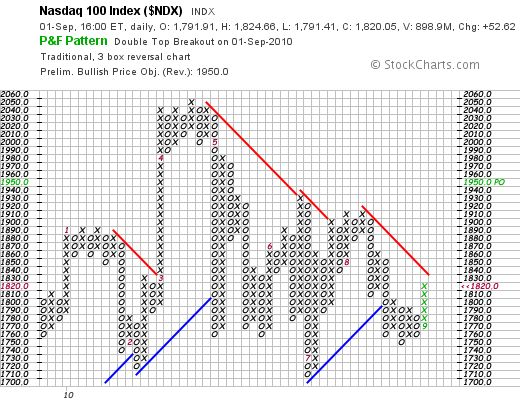
This week, I expected a rebound in the S&P within the pink triangle, since bearish sentiment reading reached extreme levels (49.8 %) Triangles are a result of aggressive buying and selling, in this case, it started with the selling after the flash crash. If the buyers are not able to hold the S&P above 1039, the bears will flush the market out of the triangle for a definitive downturn signalling medium term sell signal for equities. The same applies to the QQQQ, as you can clearly see below. The only assets that look still fine for me are the Swiss Franc, the Yen, Gold and soft-commodities.
Good Luck with trading


Good Luck with trading