Tuesday, March 8, 2011

Some Similar Patterns In The 60' Timeframe


The week started with some back and forth moves, but overal the action is absolut trendless. Below I posted some 60' Charts, so we can zoom in and understand short term price moves. Several Indices display triangles. Triangles are a result of agressive buying and selling. On a technical basis, there is no way to tell in advance if the market will break to the up- or downside. The Eurostoxx50 is the first market that moved out of it's triangle, but the support of 2925 is still holding up well. The market has certainly started a consolidation, but for a stronger move to the downside we need to break the supports mentioned below.
SPY: support is 131.08 & 129.56(minor) &127.4 (bigtime)


Dow Jones: support is 12035


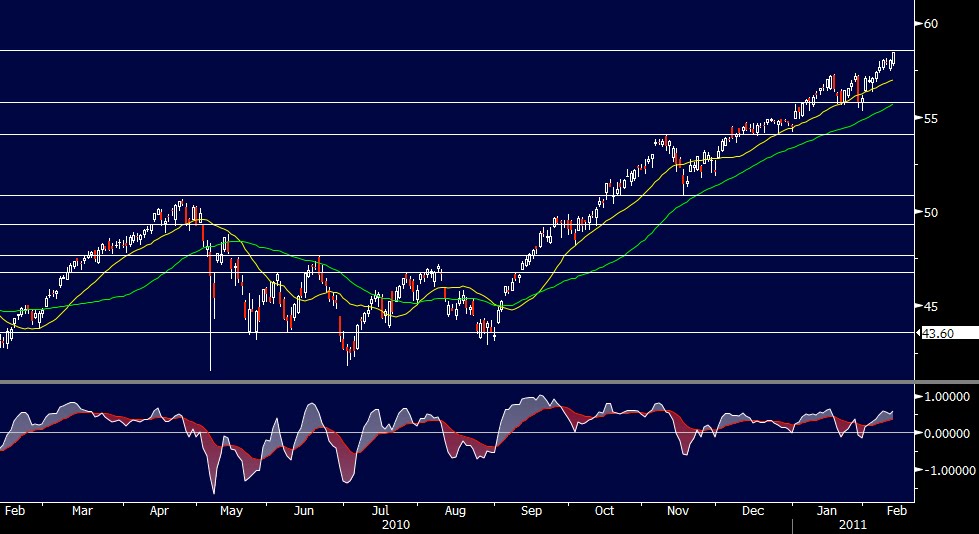
QQQQ: Resistance is 58.58 / support is 55.25
Eurostoxx: Already out of the triangle, support is 2925


SMI: Support of 6400 is important


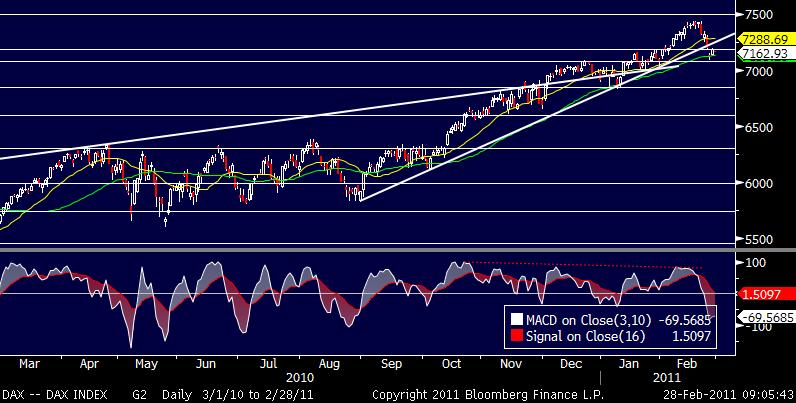
DAX: Support is 7190 & 7080


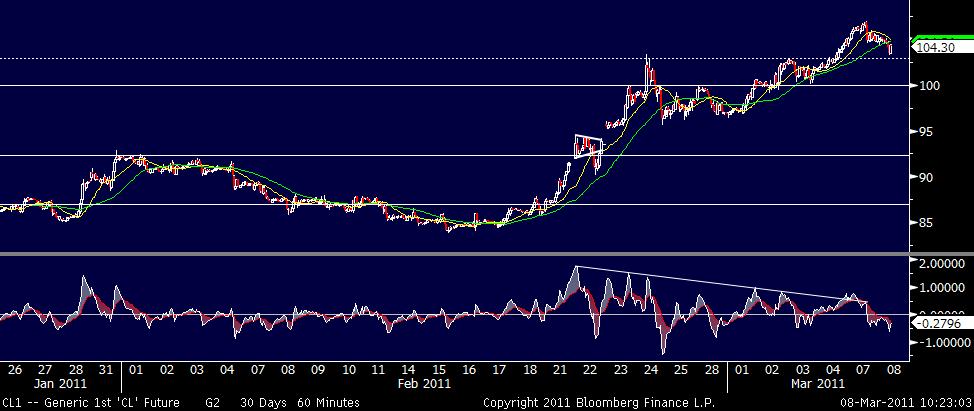
Crude: Fading momentum, consolidating above support


EURUSD: Negative divergence in the 60' the same could happen
in the daily time frame


Monday, March 7, 2011

Spring Time For Hitler


If you want to make something really bad, it can happen that suddenly the whole world agrees that this actual outcome is the best thing that ever could have happenened. Like in Mel Brook's "The Producers" where a financial consultant presents a failed Producer, Max Bialystock, an excellent idea: Making the worst Brodway Musical of all times: "Spring Time For Hitler". After some calculations, he realizes that "under the right circumstances, a producer could actually make more money with a flop than he can with a hit. ... You could've raised a million dollars, put on your $100,000 flop, and kept the rest!" Max proposes the ultimate scheme:

Step 1: We find the worst play ever written.

Step 2: We hire the worst director in town.

Step 3: We raise two million dollars. One for me, one for you. There's a lot of old ladies out there!

Step 4: We hire the worst actors in New York and open on Broadway and before you can say

Step 5: We close on Broadway, take our two million, and go to Rio.

A comparable Idea was probably QE, and the outcome is as surprising to most of us as on Broadway. Mr. Gross from Pimco wrote in his latest comment:

"No clue or outright signal could have been any clearer than the one given in December 2008, labelled “Quantitative Easing.” While the term was new, the intent was obvious: (1) pump public money into the financial system to replace private credit that was being destroyed in the process of deleveraging; (2) lower interest rates on intermediate and long-term mortgages/Treasury bonds and in the process flush money into risk assets – most visibly the stock market; and (3) forecast publically then hope that higher stock prices would lead to a wealth effect, and in turn generate new private sector lending, job creation and a virtuous circle of economic expansion that would heal the near-fatal wounds of Lehman and its aftermath. If that was the game plan, then so far, so good, I’d say. Interest rates are artificially low, stocks have nearly doubled since QE I’s first announcement in December of 2008, and the US economy will likely expand by 4% this year, although a $1.5 trillion budget deficit must share QE’s Oscar for most stimulative government policy of 2009/2010."

In my view, first of all, the wealth effect is not very important, since about 18 % of the U.S. population owns almost 90 % of the country's wealth. But as the US accumulates more and more debt, PIMCO is probably asking the right question:

"What an unbiased observer must admit is that most of the publically issued $9 trillion of Treasury notes and bonds are now in the hands of foreign sovereigns and the Fed (60%) while private market investors such as bond funds, insurance companies and banks are in the (40%) minority. More striking, however, is the evidence in Chart 2 which points out that nearly 70% of the annualised issuance since the beginning of QE II has been purchased by the Fed, with the balance absorbed by those old standbys – the Chinese, Japanese and other reserve surplus sovereigns. Basically, the recent game plan is as simple as the Ohio State Buckeyes’ “three yards and a cloud of dust” in the 1960s. When applied to the Treasury market it translates to this: The Treasury issues bonds and the Fed buys them. What could be simpler, and who’s to worry? This Sammy Scheme as I’ve described it in recent Outlooks is as foolproof as Ponzi and Madoff until… until… well, until it isn’t. Because like at the end of a typical chain letter, the legitimate corollary question is – Who will buy Treasuries when the Fed doesn’t?"

With the recent rise in commodity prices, as well as the hawkish comments made by the ECB, the USD came under heavy selling pressure this week, and as a result of this, the discussion on reserve currency status is reemerging. If the FED & the Treasury do not take steps to protect the USD against it's devaluation, it will be extremly difficult for the US to sell Treasuries at the current market rates.

As for the overal market action over the past 2 weeks, most Indices display volatile sideways action. Despite the rise in Oil prices, equity markets remain resilient, and we still don't have one single sell signal in place, neither in Europe, nor in the United States Of America. For now, the worst idea, creating more debt to heal a debt problem is working for the markets. Probably a phenomenom like in Mel Brooks Brodway act. The producers of QE are certainly surprised how well it worked on the short run, but the side-effects are just starting to show up now, and they are not very welcome.


Vix: out of the downtrend, but resistance at 23 remains intact.


XEG: Huge run for Canadian Oil producers 23 is resistance


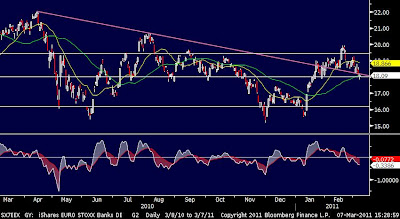
European Banks: a break of 18 would not bode well for the bulls


SPY: Not a top yet. Support for the SPX is 1307.9


QQQQ: Rise in Oil should reduce IT-spending, but not a top yet


Dow Jones Industrial: The message is clear: Has to hold 12000 & 11850


Eurostoxx50: Only a fall below 2900 would give a sell signal


SMI: Boring, as expected, we had a fake-out.


DAX: Leaving the uptrend, but no clear sell signal yet


Gold: Trading at all time highs. Difficult to get in here. Waiting for a setup


Crude Oil: Heading towards USD120, next res. is 110


DXY: Testing support soon, I do not expect it to break.


EUR: More interventions by the ECB through rate rise will probably kill the EU ecomony.


USDCHF: Broken support, wait and see what happens could be a fake out.


Cameco: Not following crude, stalls at resistance.


GOOG: Crude Oil is probably the break on this one...

Monday, February 28, 2011

Finally A Reason To Take Some Profits

Equity Markets finally found resistance and started to correct the recent bull-run as riots in the middle east intensified and western countries had to aknowledge once again that they have been supporting corrupt regimes for too long. The canary in the coal mine remains Saudi Arabia, with a totaly corrupt family running the country for over half a century. For now, the Saudi Family has not been a target, but we should keep a close eye on the region as the situation remains far from stable.


The rise in Crude Oil has weakened the US-Dollar substantially during the past week, especially against the Swiss Franc, which has been the safe haven trade once again. As a result of that, the EURUSD tried to break above 1.38. I would have to close shorts if we trade above 1.3950. I will increase shorts if we break below 1.3440.


CBOE Volatility broke to the upside, leaving it's downtrend. This is something to watch closely. The VIX Index has strong resistance at 23 and a break above this level would be an indication that the correction become an 8 - 10 % drop.


My favorite sectors to short right now are the European Automobile Sector, as well as European Banks. I will post some sector charts later in the day.


I expect a rebound in equity markets this week, but the chances for a short term top are definitely increasing.


EURUSD: Helped by ECB comments and the rise in crude.


Crude Oil: The Momentum is telling me this move aint over


Gold: If we break above USD 1430, there is no top...


SPY:


Dow Jones Industrial


Eurostoxx50


SMI


DAX


Sunday, February 13, 2011

Will There Be A Looping In This Current Rally?

Remember the double dip talk about a half a year ago? This was at a time when people did not believe in the recovery, and started to sell equities again.The FED´s quick reaction with money printing, "aka QE2", helped the market not only to regain confidence, but as Fred Hickey notes in his February Report, helped to jumpstart the return of a stock market mania that was reminiscent of 1999. He further notes:

“Relentlessly rising stock prices, extremely unattractive alternatives (zero percent interest rates with inflation rising – a negative real rate environment) and the knowledge that Big Ben, with his virtually unlimited money printing capability and his desire to see stock prices rise, are the ingredients encouraging the return of wild stock market speculation.”

Hickey also sounded the alarm bells for technology stock investors who are buying high PE multiple stocks such as VM Ware, Amazon, Salesforce.com and Netsuite.

"Once again, the risks of steep losses are high. Tech stocks are currently levitating on the assumption of a continuous flow of Fed juice. If that supply is interrupted for any reason (high inflation, the need to defend a plunging US dollar, etc) then heaven help the retail investor being lured into overpriced tech stocks today."

Even though I have to agree with the above, it was Mr. Hickey who said the following at the Barron´s Roundtable:

"I wouldn't short stocks, particularly tech stocks, in a money-printing environment." When there is tremendous liquidity coming into the market, investors seem to gravitate toward tech and they lose all concept of valuation. These stocks will get crazier. I am worried the tech sector is going to have another collapse, as it did in 2007-08 and 2000 to 2002."

But Mr. Hickey also noted:

"Google isn't a bad play, but there is some danger in all this spending. Given that, I am recommending Microsoft again this year. It is the cheapest of all."

Buying the cheapest could turn out to be a bad decision, when it comes up to MSFT and GOOG. If the later starts to rise again next week, it is a clear sign that the market starts to reward something Mr. Hickey does not see at this point in time. Mr. Hickey has all my respect for his work his has done, but maybe he will come out with a sudden change of mind this year, when it comes to GOOG.

Last week Microsoft decided to team up with Nokia, but this new alliance has been punished by the markets. Google, on the other hand, rose to USD 624.5, challenging once again break out territory.

GOOG: If momentum picks up, we have to add.

MSFT: Breaking support, money flowing into GOOG?

The rise in equities last week has once again seen very low volumes and Indices look more and more vulnerable to correct some of the recent gains. Momentum does not confirm the new highs set by the Stock Market Indices last week. But for now, there are no clear signs of a top.

SPY: Heading towards resistance at 133.84

QQQQ: Challenging resistance at 58.56

S&P100: Momentum looks worse than ahead of the flash crash

NYSE: Don´t like the momentum indicator here; stalling at resistance.

Dow Jones Industrial: "In best technical healthy condition..."

Eurostoxx: Struggling with resistance; momentum divergence

DAX: Break out more successful here, next resistance 7500

SMI: Break out at 6700, but not much upside potential.

Crude: Make or break situation here...


SDF: Still struggling with 58, but momentum is impressive.

SYNN: Break out after Q4 result and announcement of restructuring.


USD: Working on a bottom, but still a fragile plant...

USD P&F

EUR P&F

EURCHF P&F: "The Urs Schwarzenbach break-out"

USDCHF: Heading towards parity, wait for the break out