Sunday, January 30, 2011

There Is Nothing More Frightening Than Ignorance In Action


I found this sentence in Satyajit Das´s Blog - Fear & Loathing in Financial Products, and as the author says, an observation made by Goethe. It goes on:

On 30 July 1998, Alan Greenspan, then Chairman of the Federal Reserve argued that: “Regulation of derivatives transactions that are privately negotiated by professionals is unnecessary.” In October 2008, the now former Chairman grudgingly acknowledged that he was “partially” wrong to oppose regulation of credit default swaps (“CDS”). “Credit default swaps, I think, we have serious problems associated with them,” he admitted to a Congressional hearing. His current views on wider derivative regulation remain unknown. Politicians and regulators globally are currently busy drafting laws to regulate derivatives. A common theme underlying the activity is an absence of knowledge of the true operation of the industry and the matters that need to be addressed.

In DAVOS, at the yearly reunion for overrated Million- & Billionaires, surrounded by exactly those politicians, the common sense was that the economy is improving - and listening to Joe Ackermann from Deutsche Bank, one could think that the actual recovery is unstoppable. "Growth in emerging Markets remains strong", he says and as Greece gets downgraded to junk, he continues: "There is no way that Greece or Spain are going to default." Meanwhile, a solid framework for regulations on investment banking- and derivative transactions is not in sight. As the author Thomas Pynchon warned:

“If they can get you to ask the wrong questions then the answers don’t matter.” Simplistic causes and solutions may prevent real issues in relation to derivatives from being debated and dealt with."

The Obama Administration’s proposed “Volcker Rule” prohibiting major banks engaging in proprietary trading may, if implemented, affect speculative activity in derivatives. The proposal would prevent banks from hedging their own exposures using swaps as well as trading swaps. At a minimum, it would force banks to move their derivatives activities into non-bank entities. Transferring such activities would require additional capital (estimated at $20 billion or more) and also result in higher cost of funding for the derivatives activities. It is not clear how this proposal actually addresses any of the fundamental issues relating to derivative activities.


Hedging Activity?
The last week has ended with a sell-off that hit equity markets across the world. The main reason, market observer say, were the mounting tensions in Egypt. So is there fear in the market? Looking at hedging activity, the US CBOE Volatility Index Point & Figure chart is a helpful tool. The Index has made a quadruple bottom break down, a very strong sell signal but now the Index reverses this sell signal as it did a this very same level in spring 2010. So last week we have just seen a small reversal pattern that has not given buy signal yet. A break of the downtrend, indicated by the white line, would be a clear indication that equity markets are running into trouble and could head for a bigger downside move. But for now, it does not look as if investors are worried. In fact, the level indicates complacency.

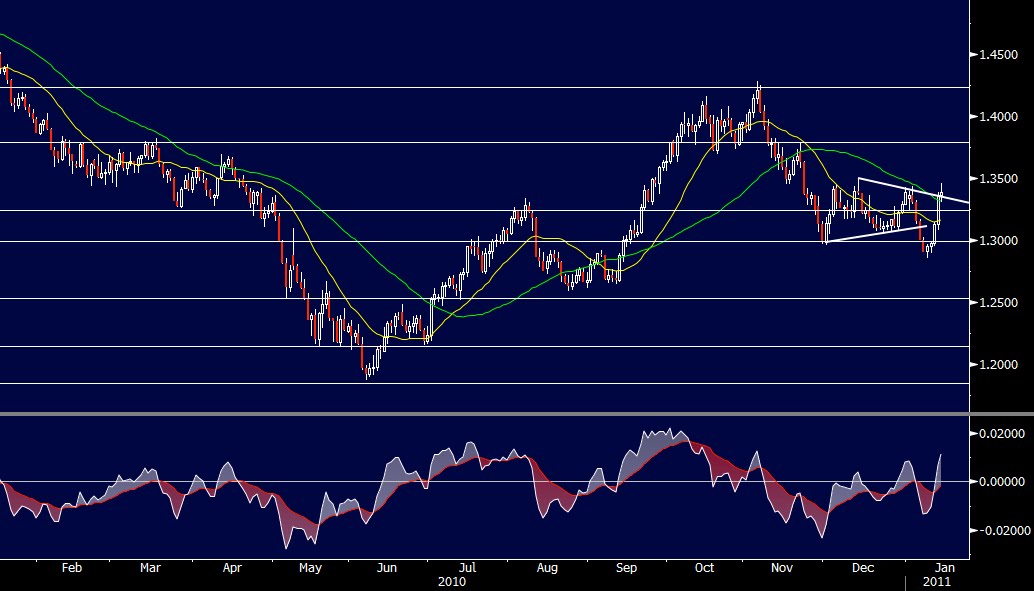
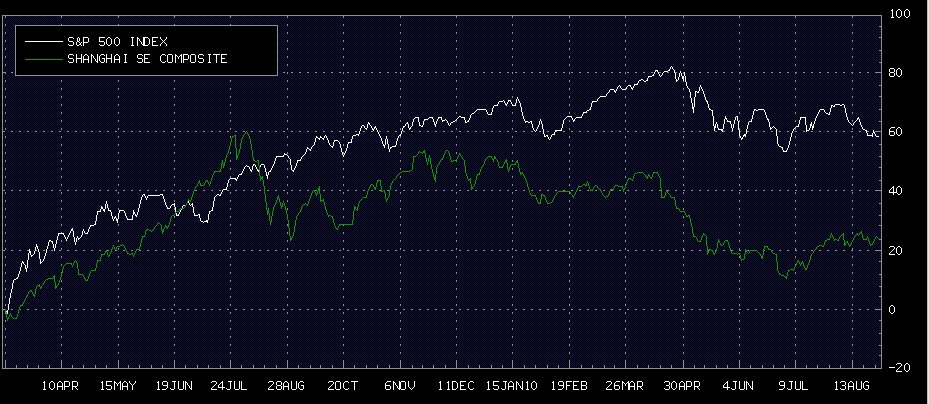
Focusing on the rally in commodities and equities that has started beginning of september 2010, we have to admit that some trends are broken and some could break soon. If markets are heading for a bigger correction can not be confirmed, nor ruled out at this point in time. I still view the biggest threat for financial market coming from the EUR and China, where as the US is certainly out of the woods for the next 6 month, probably the outperforming market until summer.

SPY 60´: Trend still up, but "break out profits" are gone.

QQQQ 60´: Trend break & a retest, starts to look topish.

Eurostoxx: Failed at resistance but still above trend channel.

SMI: The break out of this triangle is a bad sign short below 6400

DAX: 7000 becoming an important level. No trend break or double top?

EURUSD: Overshooting and a strong sell here. Probably interventions.

USD: Working on a bottom, not much downside from here

Gold: Will not buy until USD 1256

Crude Oil: Looks like the beginning of a top

GOOG: Gave a sell signal but would buy around USD580

SYNN: Still no break out

SDF: Could fall below 50 short term if 53 does not hold

NESN: Is something to watch below 50

European Banks: If there is no break- out I would short below 18

Bayer: Short Candidate in the DAX. Broke 54, giving a sell signal.

Shanghai Composite: Somebody´s buying but does not look good

Brazil: Fighting with the last support

India: Under heavy selling pressure


Sunday, January 16, 2011

Stocks To Watch in 2011

Some companies have exceptionally strong balance sheets, some others have outstanding positions versus their competitors and the third group finds it self in a strong growing market. I have four big cap. companies, that fulfill these "criterias" and are worth buying the dips, but do that respecting support and resistance.

Google: Market leader, good acquisitions, undervalued.

Synthes: Working on a long term bottom, great balance sheet.

Syngenta: Soft commodities started a strong bull-market in 2010

Kali & Salz: Also here, Agriculture markets will move this stock.

.


Kicking The Can Further Down The Road

Happy New Year, may all your wishes come true this year, after all, the next financial nightmare is just around the corner...

Equity Markets started the new year on a mixed note, with a bumper in the first week of trading, followed by a strong rebound in the past 5 trading days. Tracking the US Presidential cycle, market analysts have a strong consensus for positive equity returns in 2011, with expectations running between 15 % 20 % for the US markets. In fact, the 3rd Presidential year in the US has given an average return of 23 %, making the remarkable bullishness more understandable.

My own view is that markets could be up 10 - 15 % in 2011, but it will also be down at least 10 % once this year. I expect volatility to return to the markets and 2011 to be a transition year, with the secular bear trend continuing it´s course latest beginning 2012. None of the problems that have caused the last crisis have been addressed or solved. Basel III looks like a joke in the face of the last banking crisis and the government´s response to the world wide debt problem with more debt is jus the frosting on the cake. With central banks starting to manipulate bond markets, like the FED, who now owns more Treasury Bonds than China, and the ECB, who starts to buy totally overvalued Eurobonds to protect it´s own worthless currency, are just two bright examples how we witness the biggest manipulation of financial markets in history. That this is going to end very badly is for sure, but the question is how and when.

As we look back on past financial crisis since the stock-market crash in 1987, after which the incredible path of market intervention´s by Central Banks world wide started to intensify, we witness a clear and simple 4 year crisis cycle all fueled by a manipulated and over leveraged "financial system": 1987: Stock-market crash; first Wall-Street self made credit crunch. 1991: Savings & Loan scandal & LBO crisis; Wall Street going wacko. 1994: Mexico Tequila crisis: Bond markets going wacko. 1998: LTCM-crisis; Emerging Markets getting slamed. 2001: definite implosion of the dotcon bubble, probably one of the greatest Wall-Street scams. 2003: Enron, Worldcom etc... scandal; balance-sheet implosion on Wall-Street. 2007: subprime loan crisis. Indeed, the 4 year crisis cycle started to shorten a little but it´s difficult to say for some crisis, when it really started. None of the just mentioned crisis have brought us better rules ore better regulations. Instead, we are just printing money.

Looking ahead, as you can see in the Charts below, we are living in a divided world. Not only wealth distribution is getting out of control, with the top 20 % of the US population owing 93 % of the country´s assets, but also on a global basis, in equity markets right now. Where as especially the US stock-market is breaking every resistance since the FED has announced QE2. BRIC Nations on the other hand are rather fighting with support than resistance. This comes probably from the fact that in China and India, inflation is running out of control. Of course, the Government does not confirm that. Now the crucial question for the industrialized world is how emerging markets will handle the current inflation problem. Quote Felix Zulauf:

The emerging world has experienced high levels of growth, but it is entering a period of rising inflation. How emerging economies handle that inflation will be the decisive factor for the industrialized world. If they decide to fight inflation with really restrictive monetary policies, we're in trouble. If they hike interest rates only a little to restrain growth, the cycle can be extended. But that means later on, perhaps in a year or two, they will have much higher inflation and will have to crunch it. The choice is between more growth in the short term and then a crunch, or a more serious bear market now.


Rather sooner than later, we are going to be in trouble again. With the S&P500 trading almost at 1300 and the Dow Jones Industrial just below the 12´000 barrier, I don´t see a good risk reward for equity markets at this point in time. There are some individual names that are looking extremely interesting, but for now, I would rather buy the dips, than chase the rallies. I expect a correction in Q1 of about 10 %, followed by a rally, that could take us higher, but it will be the start of distribution phase, marking the next big top in the current secular bear market. For a trader it should be a good year. For an investor, I see it rather difficult.


SPY: another low volume break-out, 127.4 support, momentum weak.


The Sox is pushing the QQQQ, this is too good to be true

SMI: Weighted down by the health-care and financial sector

DAX: Car Sector and Cylclicals rally, but heavily dependent on BRIC


Gold: Building a short term top, but the long term bull-market isn´t over

Euro: Rebound should stall between 1.34 & 1.35. It is a sell

USD: Gains erased by EUR manipulation, buliding a bottom in 2011

China: Real-estate bubble about to burst, inflation out of control

India: Probably the most dramatic top in equity markets right now

Brazil: Rebound helped by the US-rally, but working on a top.


Friday, September 24, 2010

The Usual Suspects

The Financial Sector is under heavy selling pressure once again after European Bond-Spreads fuelled fears that things in Europe are not as pretty as investors wish it to be. As the Atlanta Fed notes in its latest comments, European bond spreads have, for the most part risen and remain elevated since the August FOMC meeting. As of today, the Ireland-to-German spread has increased to 418 bps, and the Portugal-to-German spread has increased to 402 bps - both new records.


On top of that, the release of the existing home sales data for August is showing an increase in inventory by 1.5 % YOY and the year-over-year increase in inventory is especially bad news because the reported inventory is already historically very high (around 4 million), and the 11.6 months of supply in August is far above normal. As calculated risk notes in its latest report, inventories will put downward pressure on house prices.


The implication for the overall market is that this correction could last a little longer. Looking at the SPY (S&P500ETF), we can assume that it will be difficult to hold the support around 112.51. If this is the case, the market will likely test the next support at around 109.51.

Wednesday, September 22, 2010

The US-Dollar Is Resuming It's Downtrend

The two first Charts below are showing the USDCHF cross over different time frames. To get a long term perspective of this currency pair, I plotted the monthly chart since 1992. For the past 2 years, the USDCHF cross rate is displaying a huge Flag, which in fact is a trend continuation pattern. This currency pair will test the all-time low of 0.9790 in the coming days.


USDCHF: A fresh new sell signal in the daily time-frame


The question is, if it can hold the all-time lows. An answer for a short term move could give us the daily price structure of the EURUSD cross rate. The Euro broke to the upside against the US-Dollar at 1.3230. The Point&Figure chart will confirm the break-out, once we are trading above 1.3405. The technical picture for the US-Dollar deteriorated sharply after markets started to expect more quantitative easing by the FED.


Looking at the current technical set-up, we can expect acceleration to the downside for the US-Dollar once the Euro is confirming its break out against the USD and the Swissi has made a new all-time low. Last but not least, Elliott Wave's Prechter says he is bullish on the US Dollar. Maybe we are trading in the 5th. wave... Time will tell.

Monday, September 20, 2010

Kali & Salz Heading Towards A Major Break-out

Kali&Salz (SDF) has been trading in a triangle for almost 18 month. Today, the stock is rising sharply, accompanied by good momentum and breaking the triangle resistance at EUR 44.2. A confirmation of the break-out will take place at EUR 46. Soft-commodities are once again on a strong note this morning, supporting this morning’s rise in K&S.


Trading The USD Ahead Of The FED Meeting

The USD starts the week with a fall towards crucial supports. With the FED meeting ahead, traders do not believe that the US currency will get a lot of help from that meeting. The important support to watch this week is the 79.56 level. Once we break that level, a new clear new sell signal will emerge, which could spark another round of buying in the commodity space.


DXY P&F: Will give a sell signal @ 79.56

Thursday, September 16, 2010

Shanghai Composite Index falls, Europe and US remain strong

Chinese property prices will start to fall sharply next quarter and the decline will extend into the first half of 2011, a government researcher said in remarks published on Thursday. There where also rumors of deposit rate caps to be lifted. We usualy gauged the strength of the Chinese economy by watching the price of copper and oil. But with the expectations of more Q-Easing from the FED in November, investors have been fleeing into commodities for the past several days and hence, commodities could be a bad indicator for the health of the Chinese economy. It is certainly worth having a look at the technical picture of the Chinese Stock-Market.

SH COMP P&F Chart


SH Composite


On the other hand, we have European & US Indices that keep on challenging important resistance levels. It will be interesting to see how investors behave next week, after Friday's Options & Futures expiry. If too many Investors have locked in gains by writing calls on their positions, it could well be that they will be forced to deliver stocks against short calls. If this is the case, equity markets would be well protected to the downside since investors will give up exposure through the expiry. There could be a real capitulation of the bears ahead, that could push the markets up again in the comming weeks. I would not view this upmove as a long term positive buy signal, but rather some more action of a top building phase.


SMI: remains in break out territory


DAX: heading towards break-out territory


SPY: break-out territory


QQQQ: break-out territory

Latest AAII Investor Sentiment Survey:

The worrisome factor in this market is the steady rise of bullish sentiment, as the market is trading around the obvious resistance levels:

bullish: 50.9 % - up 7

neutral: 24.9 % - up 0.3

bearish: 24.3 % - down 7.4