Thursday, September 9, 2010

SPY Meets Gap Resistance @ 111.5

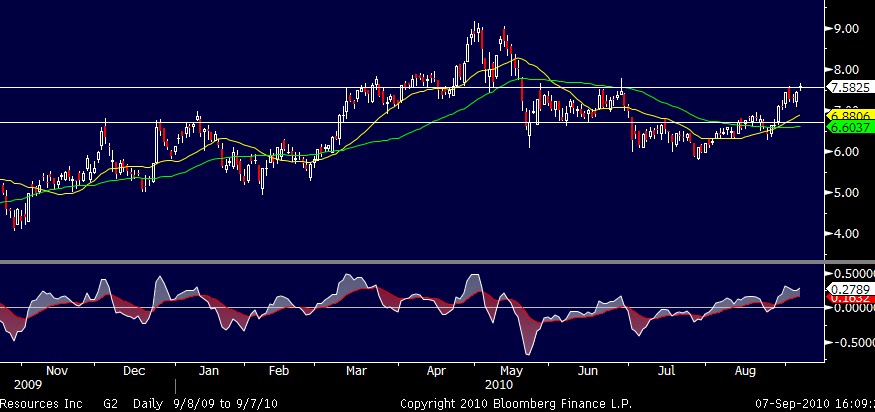
The Chart below plots the hourly price structure of the S&P500 ETF "SPY". On Thursday, the market gaped to the upside after better than expected economic numbers but faces now resistance at the gap resistance of USD 111.5. Traders have to be aware that this recent rebound has been accompanied by very low volume and there is still no evidence that investors are heavily buying into equities. In addition, there is still a negative Momentum divergence in place, showed by the red lines.


This Friday, Credit-Suisse is writing in their morning report, that there is still a lot of cash on the sidelines and they see Fund Manager sitting on 30 % cash levels. This may be true, but the question is what the money will be used for. It looks as if Equity Funds are getting hit with waves of redemptions. The chances are high that this cash will not flow into equities in the short run. Also, the high level of bearishness has been reduced and bullish sentiment is on the rise. A further rise in bullish sentiment this week coupled with a low volume rally could be an indication that this move to the upside has no legs.


Wednesday, September 8, 2010

Flight To Safety

The Chart below compares the daily price structure of the EURO STOXX 50 versus the European Healthcare Sector. After the strong rebound in the main Indices, Healthcare has continuously been accumulated by investors and the sector is now showing a clear outperformance vs. the broad market since the beginning of the year. I do not view this as a positive development for equity markets going forward as more investors do not believe in a sustainable recovery of the economy and hence start to buy a defensive sector like healthcare.


Tuesday, September 7, 2010

Gold Rises On FED Comments

PIMCO's Tony Crescenzi says the FED wants to push Investors from money market funds. I bet this is not a good idea. Following the comments, Gold rose to an intraday high of USD 1259.75. The ultimate Resistance that has to be broken is @ USD 1269.5. Wether the FED wants to push Investors into equities or commodities remains to be seen. For now, only Gold is on the rise. Gold is now moving out of a bigger triangle on healthy momentum. Unfortunately, the strong downside momentum impulse has been erased with the strong rebound on Friday and the chances to buy below USD 1244 are suddenly very small. A better place to look at right now are Gold Stocks.

XAU 60'

A stock that is ready to break out to the upside is NovaGold (NG). A break out of the trading range would take place at USD 7.56. The break out would be confirmed at USD 7.84. Take the 20 Day Moving Average for a close Stop loss. The rally is over if Novagold falls below USD 6.70.

NG Daily


Monday, September 6, 2010

Bailing Out The Kabulbank

....Yet U.S. officials worry at the same that its woes and the government-financed bailout, brought on by allegations of corruption and insider dealing, will set back faltering Western efforts to restore confidence in President Karzai's administration, a pillar of the allied strategy for defeating the Taliban.


full report:

http://online.wsj.com/article/SB10001424052748704095704575473650615414666.html?mod=WSJ_hps_LEFTTopStories

60' SPY & Sentiment Indicators

The chart below plots the 60’ price structure of the S&P 500 ETF SPY. After having gapped up above resistance, following a better than expected U.S. jobs report, it managed to close at the days high, despite the negative divergence in place. The next resistance is located at around 112.3, where the August Gap would be closed. Despite the strong advances of the past week, bearish sentiment remains relatively high. This could be a positive event for equity markets in the beginning of the week.


Last Weeks AAII Investors Sentiment Readings:

Bullish: 30.8 % Bearish: 42.2 % Neutral: 27.0 %


Friday, September 3, 2010

Negative Divergence On The SPY

As everybody has suddenly a positive view on the "mild but sustainable" recovery of the US economy, it would be wise to take some chips of the table. The SPY got rejected at gap resistance, and the momentum is slowly fading away. It will probably take some time until the negative divergence puts in a real sell signal, but the short term upside looks very limited from here. Traders who have bought the market on a contrarian basis at the beginning of the week probably have no problems with selling ahead of a long week-end.

SPY, hourly with MACD


Gold Gets Hammered After Non Farm Payroll Data

Gold broke support at USD 1244 after the release of the U.S. non farm payroll data. The MACD is showing an impressive new momentum low, suggesting that the correction could last a little bit longer. The 20 Day moving average rises at USD 1228, next support is 1218.5. A break out in Gold occurs when it moves above USD 1269; the Bull Market in Gold is over if it falls below USD 1150. To find a good risk reward here is difficult. I still believe in a break out to the upside but there is no reason to get overly bullish or bearish here. Having a look at the daily chart, we have a negative divergence developing on the MACD, but the long term trend is intact. There could be some back and forth action between USD 1217 & 1244 until Gold decides which way to go.


Gold Remains In Break Out Territory

The Chart below plots the hourly price structure of Gold over the last 14 trading days. After breaking resistance at USD 1244, the metal now consolidates above that important level, forming a consolidation triangle. A break out of this triangle to the upside would be firmly bullish and a clear sign that Gold is challenging its all time high of USD 1265. Long positions will only pose a problem if Gold falls below 1244 again. But for now, the set-up looks firmly bullish.


Thursday, September 2, 2010

Soft Commodities: Catch Up!

The Chart below shows the comparative Returns of Syngenta Corp., Corn and Wheat. Soft commodities had a strong rally, starting mid may. As you can see, Syngenta Corp. outperformed soft-commodities which didn’t make much sence. Now Corn and Wheat are catching up…


The Chart That Rocked The Bear Cave

The Chart below is from http://www.calculatedriskblog.com/. As you can clearly see, the August ISM PMI didn't catch up with the falling Avg. Philly, NY Index and the Avg. Fed Surveys. The Bears got smashed yesterday as the Index posted a rise to 56.3 % instead of a decline, as expected from traders and investors. The current market setup suggests that it will take a little bit more time to put a top on the markets.


Wednesday, September 1, 2010

Short Squeeze

Finally we are getting the short squeeze in equities I expected in the beginning of the week. The Future led buying helps all sectors across the board in Europe. The most interesting sector to watch is Gold, where GDX is heading towards a major break out at USD 55. The pattern looks like a cup and handle and all technical Indicators favour a move above USD 55 right now. In the premarket, GDX trades at 54.51 right now, up 90 cents, but only 8000 shares changed hands.


If you are desperately looking for exposure, I would prefer a defensive sector. Looking at Sanofi in France, the company is still struggling to buy Genzyme Corp. in the U.S.If this deal would be a big positive for the company remains to be seen. What I can see from here is that the stock is moving out of a falling wedge, challenging resistance at EUR 46.5, where you can also find the 50 day moving average. A break of EUR 46.5 would give a clear buy signal.


Traders should not chase the rallies at this point, because chances are high that we witness only a rebound from the obvious support in the S&P at 1040. But keep GDX & SAN on your radar.

Tuesday, August 31, 2010

SPY & QQQQ

This week, I expected a rebound in the S&P within the pink triangle, since bearish sentiment reading reached extreme levels (49.8 %) Triangles are a result of aggressive buying and selling, in this case, it started with the selling after the flash crash. If the buyers are not able to hold the S&P above 1039, the bears will flush the market out of the triangle for a definitive downturn signalling medium term sell signal for equities. The same applies to the QQQQ, as you can clearly see below. The only assets that look still fine for me are the Swiss Franc, the Yen, Gold and soft-commodities.

Good Luck with trading


Tuesday, August 24, 2010

Point And Figure Charts Part III

Here is an update on Point and Figure Charts for some Market Indices. What is worrisome for me is the fact that European Indices do not show a buy signals as the NDX and the Dow does. If the U.S. starts to outperform, it would be a clear sign that the bear market could resume in the not so distant future.


Ps: Don't be fooled by P&F Price Objectives, they can be misleading and should
not be used to make an investment decision. The good thing about it is that you
can see at once if the underlying is on a P&F buy or sell signal.